DOT Bike Counts Are In and NYC Cycling Hit New Highs in 2016
Cycling in New York City continued to climb last year, according to the latest metrics from NYC DOT [PDF]. The new stats show that while cyclist counts in the center city aren’t increasing as rapidly as they did from 2005 to 2011, Census counts of bike commuters are rising as fast as ever.
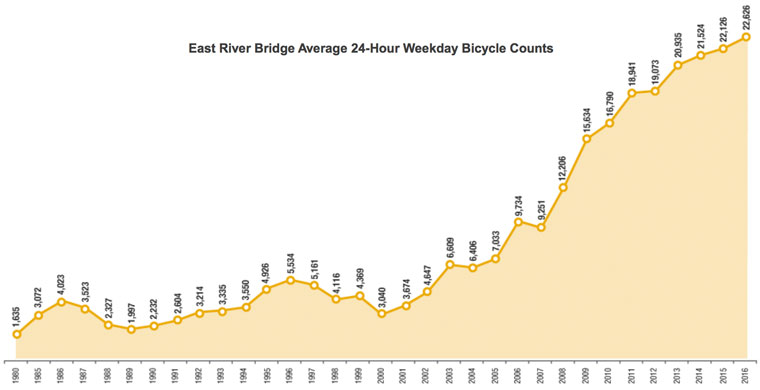
In 2016, bike counts at the four East River bridges increased 2.3 percent and counts of cyclists crossing 50th Street increased 17 percent compared to the year before.

The report also shows the growth in Citi Bike ridership as the system has expanded. The average daily number of bike-share trips jumped from about 27,300 in 2015 to about 38,500 in 2016
With the bike-share network growing up to 125th Street, it’s not a surprise that bike counts at 86th Street increased 11 percent compared to the year before. This is the first time DOT has released the 86th Street counts as part of its annual cycling report:

Meanwhile, in the annual Census survey, the three-year average of daily bike commuters increased to 45,000 in 2015, up from 41,800 the previous year.
Extrapolating from the Census numbers, DOT estimates that New Yorkers make 450,000 bike trips on an average day (because in general, commuting accounts for about 20 percent of all trips).

While DOT has recently said it intends to develop new metrics to track citywide cycling trends, those are not in evidence except for the 86th Street counts. With significant bike infrastructure investments underway or in the pipeline for locations like Queens Boulevard, the Grand Concourse, Bruckner Boulevard, and the Harlem River bridges, expanding the scope of the bike counts makes more sense than ever. Rumor has it that more bike count locations are in progress, but DOT said it has no plans at this time to release annual bike counts for outer borough locations.
DOT released the bike count data much earlier this year than in 2016, a welcome change. But the stats would be more timely and reliable if they were released as feeds on the city’s open data portal. Last year, the city didn’t release the breakdown of Midtown bike crossings on each avenue and the Hudson River Greenway, an oversight that an open data feed would help avoid.
Correction: This post originally stated that the more rapid increase in citywide biking in the Census, compared to bike counts at the East River bridges and 50th Street, indicates that cycling may be growing faster citywide than in the center of town. However, the Census numbers also show that the largest growth in cycling is happening in Manhattan, making that theory unlikely. The post has been amended to reflect the borough by borough Census data.