Majority of New Yorkers Want Street Safety Improvements, Bike and Bus Lanes: Poll
The broad-based support for life-saving changes swamps the vociferous rump that objects — especially since the pandemic, according to a TransAlt survey.
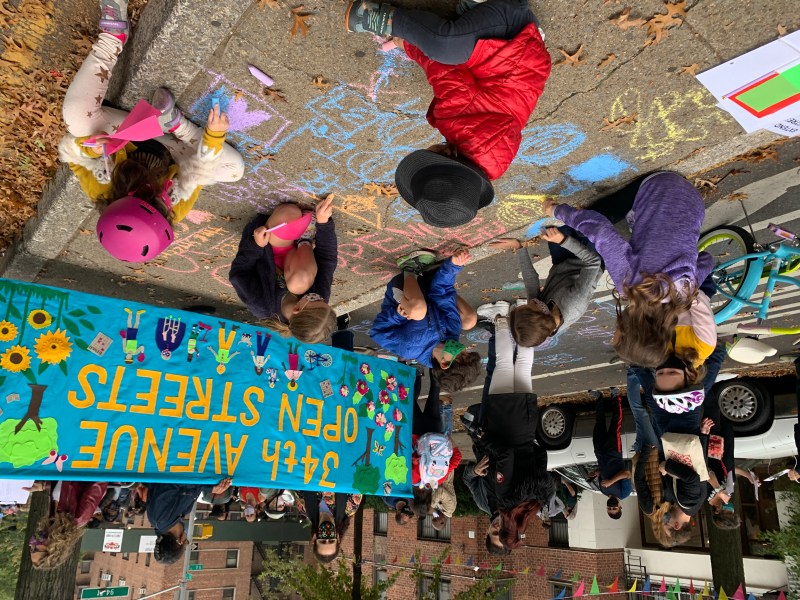
New Yorkers who support lifesaving street improvements vastly outnumber the disgruntled car owners who squawk about losing parking spaces at community board meetings across the city.
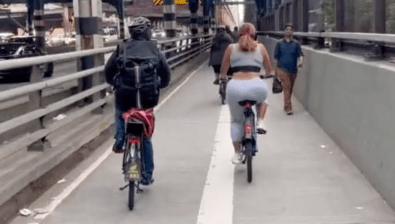
A new survey found broad, majoritarian support for any number of safety and pro-transit street improvements that sometimes claim parking spaces, including protected bike and bus lanes, open streets, crosswalk daylighting, and wider sidewalks. The support for livable streets found by the Siena College Research Institute/Transportation Alternatives poll even extended to a majority of respondents who live in households that own cars.
“The majority of New Yorkers want streets that prioritize people,” Transportation Alternatives Executive Director Danny Harris said. “City streets must become fairer, healthier, safer, and put people first as we recover from the pandemic. With this latest polling, it’s clear that candidates running with bold plans to reimagine New York City’s streetscape will have public opinion on their side.”
The poll, a telephone survey of 805 registered New York City voters conducted from November to December, found that:
- More than two-thirds (68 percent) of respondents, including 61 percent of car owners and majorities in all five boroughs, support the building of protected bike lanes in their neighborhoods. The poll did not explicitly ask about parking spaces, but it is widely known that such improvements often reallocate roadway space in that manner.
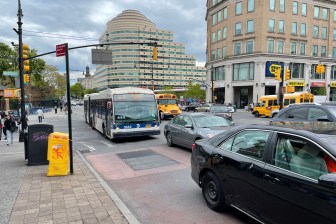
- 56 percent of respondents explicitly support using parking spaces in order to build protected bus lanes.
- 58 percent support widening sidewalks to their neighborhoods, even at the cost of fewer parking spaces.
- 63 percent of respondents, including 57 percent of car owners, support the establishment and expansion of open streets in their neighborhoods, again, even if parking is repurposed.
- 85 percent of respondents support efforts to improve crosswalk safety, such as daylighting, a share that tracked closely with other popular life- and health-saving measures such as adding trees and greenery (83 percent) and adding outdoor play space for children (84 percent).
- Open restaurants — in which thousands of eateries have displaced curbside car storage during the pandemic for outdoor dining — remains resoundingly popular, with 64 percent of respondents citywide supporting it and 74 percent of those in Manhattan.
The results put the lie to the long-standing contention of the city’s car lobby that the Department of Transportation and other agencies should not institute measures that encroach on the hegemony automobiles. Moreover, the survey showed broad support for safety measures across all classes, races, and boroughs — often belying prevalent stereotypes about such support.

For example, a strong majority of Black (71 percent) and Latino (82 percent) respondents supported protected bike lanes in their neighborhoods, eclipsing white support at 61 percent. Numbers like that reveal the falsehood of the notion that communities of color do not favor bike lanes on the idea that they presage gentrification. Sometimes that myth is promulgated by lawmakers and candidates from those areas themselves.
In another example, open streets gained majority support in all five boroughs: 74 percent in Manhattan, 64 percent in Brooklyn, 61 percent in the more car-centric Staten Island and 57 percent in Bronx and Queens. Car owners in the outer boroughs have agitated against open streets at every opportunity, some even destroying the wooden barricades that the city has erected for the purposes of marking them.
The survey also revealed that bikeshare had broad appeal across classes and seems to appeal most strongly to those making the least money, with 69 percent of those making less than $50,000 annually saying that they supported it, compared to the the 53 percent of those making $50,000 to $100,000 and the 56 percent of those making $100,000 or more. The finding suggests that Citi Bike — the one transportation mode that the city does not subsidize — has emerged as vital for the needs of poorer and essential workers and therefore deserves taxpayer support.

In one expected finding, respondents who said they had lower incomes or came from communities of color, which heavily use the buses that are often the only form of public transit, registered very strong support for dedicated bus lanes. Among Latinos, 67 percent supported them, as did 57 percent of Black respondents and 65 percent of those making less than $50,000. Only 54 percent of Whites and 53 percent of those making more than $100,000 did.
The survey, of course, also gauged the size of the vociferous rump that opposes street improvements. On core questions such as bike lanes and bus lanes, 31 percent and 39 percent of respondents were opposed, respectively, as against the 68 percent and 56 percent who supported them. A bit more than a third (34 percent) said they opposed open streets (versus 63 percent that support them), and 41 percent said they did not support bikeshare stations in their neighborhoods (versus the 56 percent that do).
In each case, a small percentage either didn’t know enough to form an opinion or refused to answer the question.
Transportation Alternatives’s research director, Philip Miatkowski, said that the survey powerfully demonstrated that New Yorkers of all stripes — and, in particular, the voters the survey measured — were responding positively to the people-centered street innovations that the city put into place during the pandemic.
“New Yorkers of all walks of life saw theory turned into practice in the last year — in terms of open streets, more biking, open restaurants, what have you,” he told Streetsblog. “They are demanding these priorities from our electeds, including more bike lanes, more bus lanes, more open streets, for recovery after the pandemic.”
The survey had a margin or error of plus/minus 3.9 percentage points.
