Bicycling Across the East River Has Plateaued
Recent improvements to the bike network continue to get more people cycling, but a new DOT report indicates there are bottlenecks at key points.

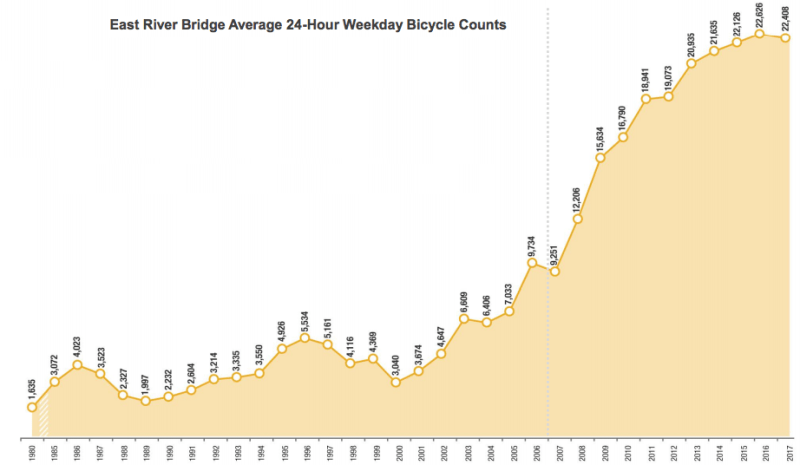
After years of modest but steady increases, NYC DOT bike counts on the East River bridges fell slightly in 2017, according to the agency’s annual “Cycling in the City” report [PDF].
On its own, a one-year dip in one metric may not signify a broader trend, but citywide indicators like Census bike commute growth also show signs of tapering off. The number of New Yorkers who say they mainly commute by bike increased only slightly in 2016, the last year for which data is available, after several years of more robust growth.
Digging into the details of the report, there’s evidence that recent improvements to the bike network continue to get more people cycling. But the de Blasio administration has to do more to move the needle and make bicycling safe and convenient for large numbers of people.
Compared to 2016, last year DOT counted more people biking across 50th Street (7.8 percent growth) and 86th Street (19 percent). These increases are almost certainly due to better bike infrastructure on First and Second avenues and Amsterdam Avenue, as well as the expansion of Citi Bike uptown.

Citywide, the U.S. Census Bureau publishes rolling three-year averages of the number of city residents who say bicycling is their primarily way of getting to work. After a five-year run where this metric increased by thousands of people each year (with jumps ranging from 1,900 to 6,100), the Census bike commute numbers increased just 800 in 2016, from 45,000 to 45,800.
Another citywide indicator comes from a Department of Health survey of several thousand New Yorkers. The number of respondents who say they bike several times a month (the dark bar in the chart below) increased 6 percent in 2016 compared to 2014:

A closer look at the East River bridge counts, meanwhile, reveals both the success of DOT’s recent bike projects and some obstacles to continued progress.
DOT’s bike improvements on Queens Boulevard and elsewhere in the borough — as well as the East Side of Manhattan — appear to be registering on the Queensboro Bridge. The 35 percent increase in daily bike crossings over the Queensboro since 2012 is more than on any other East River bridge.
It’s also a sign that the city needs to expand capacity for cycling on the Queensboro. The bridge’s north outer roadway, which is shared by cyclists and pedestrians, is already a tight squeeze. Queens residents have pushed DOT to open up access for active transportation on the bridge’s south outer roadway, which is already closed to cars at night. In response, DOT Commissioner Polly Trottenberg has said opening up a lane for biking and walking is on the table, but no concrete steps have been announced.
The downside of letting crowding issues fester is apparent on the Brooklyn Bridge. Daily bike crossings on the bridge fell 13 percent in 2017 and remain no higher now than in 2012. DOT is studying the expansion of the bridge’s narrow promenade, but completion of that project remains years away, if it’s feasible at all.
