How to Hold Your Elected Officials’ Feet to the Fire for Better Bus Service
A new online tool from the Bus Turnaround Coalition lets you see how bus service in every electoral district stacks up.
New York City’s buses are the slowest in the nation, with ridership dropping even as the city’s population increases. The situation won’t change without political pressure for proven bus service improvements, but even when MTA and DOT do roll out measures to make buses faster, some elected officials opt to stand in the way of progress.
Take former State Senator Bill Perkins, who recently left Albany for his old City Council seat. When the city and MTA rolled out 125th Street Select Bus Service, Perkins’ office was a hub for groups organizing against the project. He celebrated when DOT scaled back bus lanes in the plan.
Then there’s Assembly Member N. Nick Perry, who pushed legislation aimed at weakening bus lanes across the city. He claimed bus lane enforcement, which helps his bus riding constituents bypass traffic congestion, is “intended to make money for the city.” Perry said his bill would ensure that “commuters [are not] in an adversarial position with residents.”
The poor quality of service robs bus riders of time and makes it harder for millions of New Yorkers to get around the city. Now there’s a way to show your elected representatives why they need to get behind policies to make buses faster and more reliable.
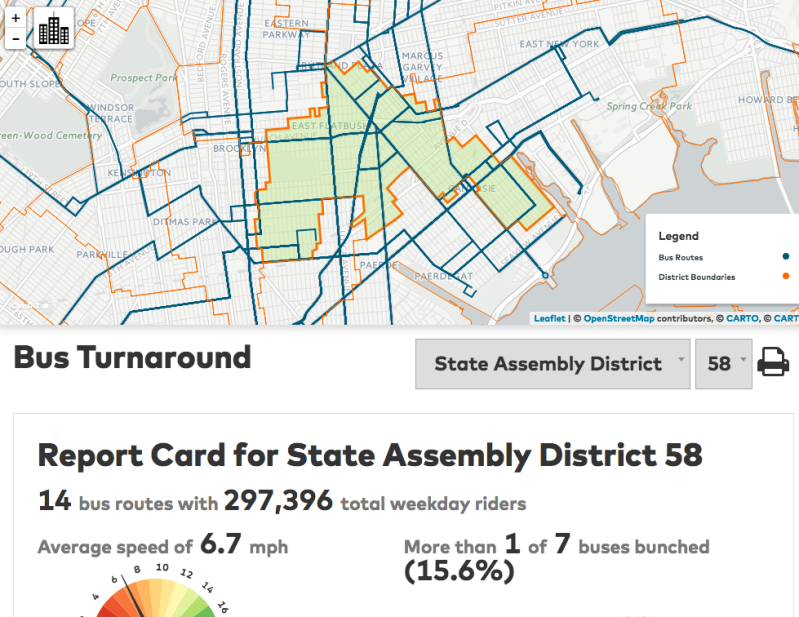
Today the Bus Turnaround Coalition released an interactive site with district-level reports cards for every State Senate, Assembly, City Council and community board district in the city. For each district you can see average bus speeds and the share of buses that bunch together and arrive at stops at the same time (like the route-by-route report cards the coalition released last year).
Perry’s district has the highest rate of bus bunching of any Assembly district in the city, with 15.6 percent of buses bunched. Perkins’ has the highest of any Senate district — 14.7 percent.

The tool also lists the three routes with the slowest speeds, most bunching, highest ridership, and fastest-growing ridership.
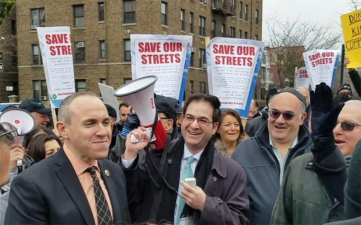
“With access to this information, riders can empower themselves to advocate for the quality bus service that they deserve, and elected officials can use this information for holding [the city] and the MTA accountable for improving bus service,” Straphangers’ Campaign coordinator Jaqi Cohen said at a press conference with elected officials this morning.
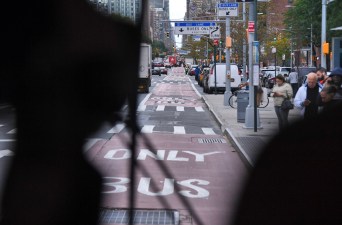
To address slow bus speeds and declining ridership, the Bus Turnaround Coalition has recommended a number of interventions, including installing more bus lanes, giving buses priority at more traffic lights, and implementing all-door boarding with tap-and-go fare payment systemwide.
“Trains take us to and from the city. For every other destination, buses are our only form of transportation,” said Trudy Cunnings, a Riders Alliance member from the Bronx. Cummings described the long waits and slow trips she endures after she finishes her shifts as a caregiver, usually around 11 p.m.
“I always thought this was the terrible experience only happening to me, but the district bus report cards really shed light on the poor bus service through New York City,” she said.
