The City Council Vote in Two Dimensions

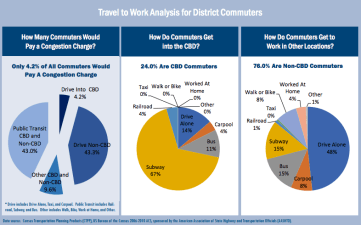
This map depicting Monday’s City Council vote comes to us courtesy of Justin Kray at the Pratt Center for Community Development. You can use the City Council website to identify who represents which district. And here’s some good data to go along with the map: car commute rates for every district.
Bill de Blasio’s Brooklyn district, number 39, sticks out like a sore thumb, as does Mathieu Eugene’s, number 40. Sandwiched between representatives who did vote for pricing, de Blasio speaks for a district where 3.7 percent of workers commute by car to the congestion zone, according to the 2000 Census. In Eugene’s district, the figure is just 2.4 percent.
Other "No" districts that immediately stand out include 22 in Astoria (Peter Vallone, Jr.) and 34 in Williamsburg (Diana Reyna). Both districts are slated to get significant transit enhancements, and Astoria car commuters already pay to drive over the Triboro Bridge or go out of their way to get to a free bridge.
Another interesting companion piece is today’s Juan Gonzalez column in the Daily News. Though his anti-pricing stance comes across loud and clear, Gonzalez provides some good insight into the horse trading that went on prior to the vote.
UPDATE: Liz Benjamin at the Daily Politics interprets the map with an eye towards 2009 elections.

