Crashstat 2.0 Reveals NYC’S Most Dangerous Intersections

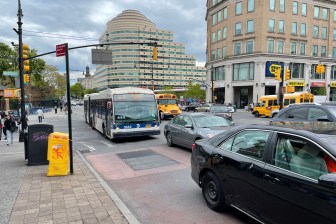
Crashstat shows Fordham Rd. in the Bronx to be one of the most dangerous streets in New York City.
For years, Livable Streets advocates have pushed New York City government to make citywide pedestrian and cyclist crash data more accessible to help civic groups and policy makers make more intelligent street design improvement decisions. Rather than waiting for government to come up with a solution, Transportation Alternatives has launched an updated version of its Crashstat.org web site using Google Maps and complete with crash data through 2005. If you want to advocate for traffic-calming and pedestrian and cyclist safety improvements in your neighborhood, this powerful tool will focus your efforts and help you build your case. From TA:
Thousands of pedestrians and bicyclists are injured or killed on NYC streets every year. With the launch of Transportation Alternatives’ newest web resource, Crashstat 2.0, New Yorkers can identify the most dangerous streets in their neighborhood and work for a safer city. This interactive website allows users to search through 11 years of bicycle and pedestrian crashes on easy-to-use Google Maps. Crashstat 2.0 displays 139,227 pedestrian crashes and 44,942 bike crashes.
Crashstat identifies East 33rd Street and Park Avenue in Manhattan as the intersection with the highest number of pedestrian and bicyclist injuries and fatalities in NYC. The intersections with the most crashes in each borough are:
• Manhattan: Park Avenue and East 33rd Street: 156 crashes
• Brooklyn: Eastern Parkway and Utica Avenue: 120 crashes
• The Bronx: East Fordham Road and Webster Avenue: 99 crashes
• Queens: Queens Boulevard and 63rd Road: 72 crashes
• Staten Island: Hylan Boulevard and New Dorp Lane: 34 crashes
"Crashstat 2.0 is an indispensable tool for New Yorkers fed up with dangerous streets," says Paul Steely White, Executive Director of Transportation Alternatives. "Anyone with an internet connection and a few minutes to spare can go online, research their streets and win stronger safety measures."
Version 2.0 includes the ability to view crash data by community district, displays community facilities (schools, hospitals, senior centers, etc.) and enables users to search through yearly data between 1995 and 2005. The original version of Crashstat.org ushered in a new era of technology-driven community activism. It launched in 2004 and compiled data from 1997-2002.


