A Snapshot of New York City Gridlock
Bruce Schaller’s new study, Battling Traffic, released this morning at a standing-room only Manhattan Institute panel discussion, digs in to the question of what New Yorkers really think about the city’s traffic congestion and the idea of using road pricing and other tools to manage it. Want to see what New York City gridlock looks like? Take a look at this remarkable map from Schaller’s study:
Evening "Rush Hour" Visualized: Average traffic speeds from 4:00 to 8:00 pm
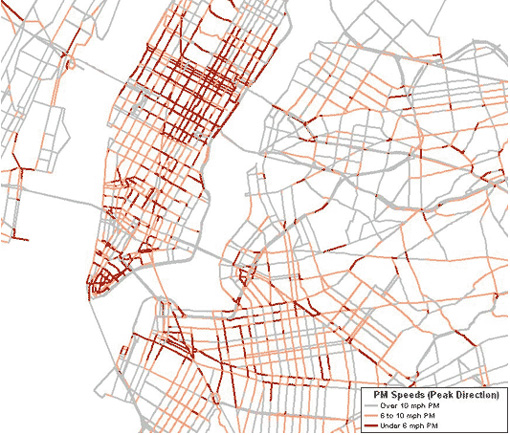
Key: Average peak direction driving speeds during the evening "rush hour."
Red: Under 6 mph
Pink: 6 to 10 mph
Gray: Over 10 mph