DOT’s Annual Scorecard Confirms: Most New Yorkers Don’t Shop and Drive

NYCDOT’s annual scorecard, the Sustainable Streets Index, adds more information about how New Yorkers get around every year. In addition to regular statistical snapshots of the city’s transportation system, like transit ridership or traffic speeds culled from GPS devices in taxis, this year’s version adds neighborhood travel profiles. Compiled from interviews in eight neighborhoods, these profiles to show just how little New Yorkers rely on cars to get around.
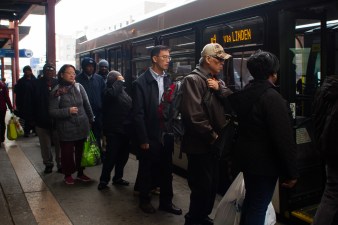
The recent news is not good, however. In 2009, the decade-long trend toward greater transit use reversed slightly, according to the report. Motor vehicle traffic increased by 0.3 percent while transit ridership fell 2.5 percent. DOT attributed the change to the effects of the recession, increased transit fares, and lower gas prices.

Preliminary 2010 numbers show what appear to be the joint effect of the uneven economic recovery and last year’s devastating fare hikes and service cuts. Subway ridership bounced back by one or two percent through October, but bus ridership continued to fall.
While the report is almost entirely a data-driven look backward, with regards to transit ridership it offers a dark warning about future trends:
The big if, however, lies in the area of overall bus and subway service. Given continued State budget shortfalls and pressures on the MTA budget, it is unclear whether the recent pattern of MTA service cuts and fare increases can be broken. In addition, the current MTA Capital Program remains only partially funded. Without firmer financing of the city’s transit system, the gains of the past decade are clearly at risk.
A new feature of the Sustainable Streets Index, the neighborhood travel profiles, offers in-depth looks at how people arrived at eight city neighborhoods and why they went there. In Union Square, for example, only four percent arrived by driving, along with another five percent in taxis. In contrast, roughly half of all people walked there and a third took the subway. Another four percent rode the bus and two percent biked.
Given that 70 percent of the people surveyed were there to shop or eat out, it’s safe to say that making parking more abundant isn’t the key to helping businesses in Union Square prosper. Similar data compiled on other commercial strips could help assuage many merchant concerns about re-appropriating parking spaces for busways, bike lanes, or pedestrian improvements.
In neighborhoods across the city, only a small share of people drive to their destinations. In Jackson Heights, only six percent of interview subjects had driven there, while 65 percent walked. At Fordham, only eight percent had driven, while the largest number — 42 percent — had taken the bus.
Even in the two neighborhoods with the largest share of drivers in their profile, a substantial majority got there using another mode. In Astoria, only 22 percent had driven. On Staten Island, 39 percent of people drove to New Dorp, with another one percent using a car service. The remaining three-fifths walked or took transit.

The report also highlights some truly gaudy bike numbers. Which streets have high cycling mode-share? One place you can’t go wrong is Prince Street, where biking constitutes 37 percent of evening rush hour traffic. On East 10th Street, 32 percent of the evening rush is bike traffic. A bike lane on Rockaway Boulevard increased cycling by 268 percent, though that number was an outlier; it was more common for bike counts to post double digit percent increases after the installation of a new bike lane.
The bulk of the report is dedicated to presenting the results of 11 major projects. Some of them, like the safety-enhancing redesign of Allen and Pike Streets or the congestion-curbing Park Smart program in Park Slope, have already been covered on Streetsblog, but here are some of the other projects:
- On Gerritsen Avenue in Brooklyn, reducing the street from two lanes in each direction to only one cut the total number of crashes by 48 percent (bike lanes were in the original plan, but were replaced by a painted median at the request of the community board). Speeding fell 30 percent among northbound cars without creating congestion.
- Where the Pulaski Bridge meets Jackson Avenue, there hasn’t been a single injury to a pedestrian or cyclist since changes were made to the intersection 17 months ago. There, a reconfigured intersection clarified vehicle movements, a pedestrian-only signal phase gave those on foot some extra time to make it across the intersection, and a new refuge island shortened crossing distances.
- After eight years of planning and construction, changes to West Houston Street cut the number of crashes involving injuries by 24 percent. Those included pedestrian refuges and neckdowns, but also sizable increases in traffic capacity.
- The changes to Park Circle, at the corner of Prospect Park, managed to decrease travel times for cars on every leg of the circle while simultaneously making it easier to walk around the circle, adding bike lanes, and calming traffic exiting the circle.
- As part of the Pelham Gardens Safe Streets for Seniors program, Allerton Avenue was narrowed from two lanes to one in each direction, with the extra space being used for a wide center median and a bike lane. There, the results have been positive, but more modest. The crash rates for pedestrians and cyclists are down, but not by a statistically significant margin. Similarly, speeding decreased, but only by four to seven percent; a majority of the cars on the road still are driving more than 30 miles per hour.
- Belying the media-generated perception of DOT as rabidly anti-car, some of the featured projects were entirely to improve automobile movement. Where the Belt Parkway and Bay Parkway meet, for example, an additional lane increased traffic capacity on Bay Parkway by 34 percent.

