New Scorecard From DOT: Driving in Decline, Safety Improvements Work
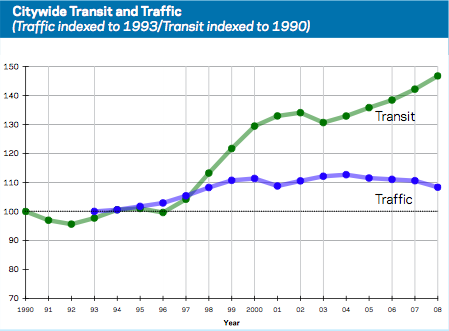
 In 2008, transit ridership continued to increase while auto traffic declined. Image: NYCDOT.
NYCDOT released the second Sustainable Streets Index this week, its annual scorecard on green transportation and street safety. This year’s edition has a few new features, including case studies of 12 projects across the city and some nifty GPS data from taxis. Taken all together, the data in the report tell the tale of how DOT’s recent projects have made streets function better for pedestrians, cyclists, and bus riders.
Last year’s index showed how transit had absorbed all the growth in travel as the NYC economy expanded from 2003 to 2007, with driving remaining essentially flat. The new index reveals how that pattern continued in 2008, with the largest decline in traffic in at least 15 years. Not all the numbers for 2009 are in yet, but it looks like the recession caused declines in both transit ridership and driving, not a shift toward automobiles. You’ve got to wonder whether transit ridership will hold its own in 2010, after the package of sweeping MTA service cuts takes effect.
Most of this year’s report is devoted to case studies of street redesigns and bus improvements across the city. Lately we’ve heard DOT cite safety stats from projects like the new Broadway and the Ninth Avenue bike lane when making the case for pedestrian and bicycle improvements, like those slated for First and Second Avenues. The new index catalogs several other interventions, often showing that re-orienting streets to serve sustainable modes hasn’t caused dreaded traffic tie-ups:
-
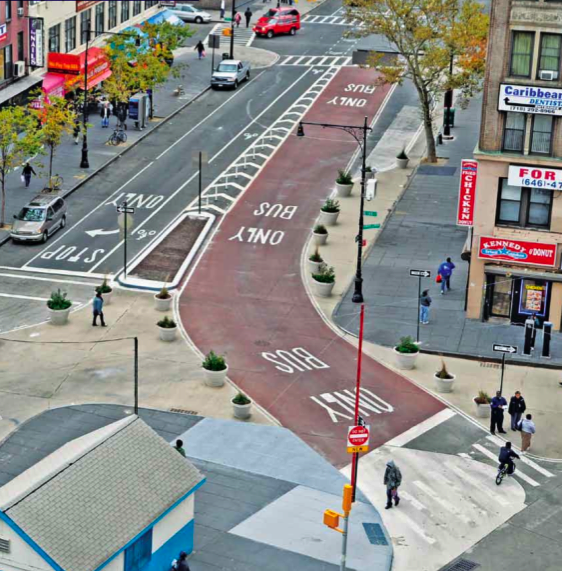
 The Bronx Hub redesign has improved conditions for bus riders, cyclists and pedestrians. Image: NYCDOT.
A 2007-2008 redesign of Jewel Avenue in Queens added a buffered bike lane, introduced some traffic calming measures and gave pedestrians longer crossing times. Afterward, bike volume along the corridor increased fivefold, and 91 percent of cars now travel at or below the speed limit. Before implementation, local politicians protested the removal of traffic lanes, but the data show that congestion hasn’t increased at all.
- At the Bronx Hub, a major intersection redesign added new bike and bus lanes and 15,000 square feet of pedestrian space, leading to the lowest crash rate in a decade.
- Changing Manhattan’s Park Avenue tunnel to northbound-only and extending the sidewalks reduced injuries from crashes at Park and East 33rd by 77 percent without delaying southbound vehicles by more than a minute.
- In the Bronx, Fordham Road’s Select Bus Service reduced travel times by 19 percent. For the typical commuter, that adds up to two extra days of saved time every year. As a result, weekday ridership is up 32 percent compared to the previous limited-stop bus service.
- The 34th Street bus lane improved speeds by 17 percent. The speed of buses in motion increased 26 percent.
- The city’s first experiment with Transit Signal Priority, which gives buses extra green light time, improved travel times 16 percent during morning rush hour along Staten Island’s Victory Boulevard [PDF].
- Along Brooklyn’s Vanderbilt Avenue, pedestrian refuges, a new bike lane, and changes to parking regulation led to an 80 percent increase in bike ridership and a reduction in crash rates.
- Skillman and 43rd Avenues in Sunnyside, Queens were being abused as high-speed alternatives to congested Queens Boulevard, so DOT narrowed the driving lanes, retimed the signals, and added bike lanes. Morning traffic speeds dropped 18 percent. Crashes causing injuries to pedestrians dropped 65 percent. Crashes that injure drivers fell 49 percent.
Measuring the effects of DOT actions not only gives livable streets
advocates the information to defend what works, it also shows which
programs need to be strengthened. The PARK Smart program, for instance, raised meter rates during peak hours in Greenwich Village, with the goal of opening up on-street parking spaces and reducing cruising. The index reports that while the occupancy rate of affected parking spaces dropped by six percent during the week, it increased by four percent on Saturdays, suggesting that meters should be priced higher to achieve the desired effect. (DOT has since raised the Greenwich Village meter rates again, to $3 per hour during peak times.) As ITDP’s recent parking report pointed out, the current PARK Smart meter rates still preserve incentives to cruise for a spot, because on-street parking remains much cheaper than off-street options.
For the real transportation geeks out there, the coolest addition to this year’s index has to be the wealth of data from GPS systems installed in New York’s taxis. Because they track every aspect of every trip that every taxi takes, these GPS units yield information about traffic street-by-street and minute-by-minute. The Sustainable Streets Index provides a few headline numbers — traffic speeds in Midtown increased by 18 percent between fall 2007 and fall 2009, for example — but DOT has already put more fine-grained data to use. The taxi GPS data is what they used to demonstrate that pedestrianizing Broadway didn’t cause carmaggeddon.
