DOT Report Shows Ongoing Driver Recklessness — And the Agency’s Slow Response to It

Three down, thousands to go.
There were 15,947 reported vehicle crashes in the first quarter of 2022, including 7,783 that caused injuries. The Department of Transportation examined 521 of those crash locations and took immediate action to improve safety at just three.
The fact that the city made improvements at just 0.02 percent of the crash sites in the first quarter of 2022 is a key finding that isn’t directly mentioned in the DOT’s first legally mandated report on severe and fatal crashes — a report that stems from a City Council law requiring the agency to create an in-house crash investigation and analysis unit to recommend redesigns after crashes.
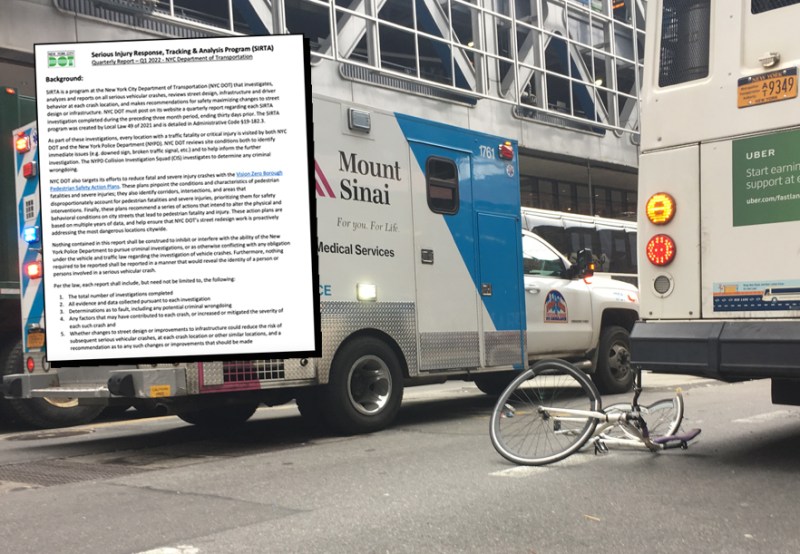
The report — known as the Serious Injury Response, Tracking and Analysis Program — looked at every crash that caused a severe injury in the city between January 1 and March 31, 2022. There were 529 severe injuries and 59 fatalities at those 521 locations.
Of the 521 crash locations examined by the new unit, 463 investigations were included in the report (the missing investigations will be included in future reports, the agency said). Out of those 463 crash locations, the agency did what it called “in-depth” investigations at just 53 locations.
And only three of those areas actually received traffic calming measures after the investigation (the remaining 50 have been set aside for potential future safety projects): Those three crash sites each got “turn-calming treatments” and one got a leading pedestrian interval timing on the traffic signal.
Advocates were disappointed that the report didn’t include more direction action or even information on where the treatments were installed or where any of the in-depth investigations on were done.
“This is a helpful document that proves there’s so much more to do,” said Transportation Alternatives Communications Director Cory Epstein. “It’s helpful to see the causes and consequences of traffic violence in one place. However, it’s disheartening to see all this data laid out, and still some dangerous corridors not being prioritized for change. A report is only report and actions always speak louder than a report.”
The nuts and bolts of the report delve into the factors that contributed to crashes and a long appendix that lists injury details for each crash location and whether any injury-causing crashes took place at the same location in the past three years. Unsurprising to anyone who has been watching how people drive, especially after the pandemic, the top contributing factor to these crashes was driver behavior, and not pedestrians wandering into the middle of the road.
Indeed, the report found that drivers are almost the entire problem:
- “Crossing With Signal” was the top “pedestrian action” taken before a severe crash, with 69 out of 200 pedestrians getting severely injured when they were simply crossing the street while they were supposed to. Only eight pedestrians were injured while crossing outside of the crosswalk and against the light.
- “Driver distraction,” listed as a contributing factor in 138 crashes, was the leading driver behavior before a severe crash.
- Failure to yield (92 instances) and unsafe speed (71 locations) were the two next most common driver behaviors before a crash.
When the City Council passed the law that established the DOT’s in-house crash investigation unit, street safety activists hailed the day as one that could lead to a deeper understanding of crashes that killed or severely injured New Yorkers. Activists were hoping to the unit could fix the historical pattern of victim-blaming that followed police investigations of crashes that injured pedestrians and cyclists, and that it could collect more and better data than the NYPD’s Collision Investigation Squad collected in its own investigations. The DOT initially opposed the proposal because it would have moved CIS over to the DOT and put the agency in charge of the law enforcement aspect of crash investigations.
And DOT executives said the bill would duplicate what the agency already had in place.
“DOT has a robust system in place for evaluating traffic fatalities and analyzing crash data to enhance safety citywide, which includes developing broadly applied design interventions based on lessons we learn from analyzing crash site characteristics, as the bill would require,” Margaret Forgione, the agency’s first deputy commissioner said in testimony on the bill in early 2021.
The DOT’s first-quarter crash report report did the bare minimum that the City Council law required — and it was also released without any fanfare and with somewhat of a shrug from the DOT itself.
“Our crash investigations are critical in helping DOT design safer streets and we remain committed to conducting thorough analyses at each location,” said DOT spokesperson Vin Barone. “We have provided a detailed quarterly report on our crash investigations as required by law.”
The agency also said that the report wasn’t the sum total of its street redesign work, which also included the agency’s pledge to upgrade 1,000 of the city’s most dangerous intersections.
“DOT’s Vision Zero work extends far beyond our review of crash sites and is not simply reactionary. We are continuously redesigning corridors and intersections with safety in mind, based on robust multi-year crash data and our equity formula, a proactive approach to traffic safety,” said Barone.
Still, the report does show that the DOT is looking at more crashes in a year than the NYPD did in previous years. CIS investigated 374 crashes during the entirety of 2020 and 390 in 2021. In all of 2022 so far, the police investigated 194 crashes, just 37 percent of the 521 crashes that the DOT looked at in its own report.


