BOOM! September Numbers Show Bike Ridership Increase is Continuing

It’s a numbers shame.
The hundreds of people who marched across the Queensboro Bridge on Sunday to demand more space for pedestrians and cyclists mostly made the human rights argument: that long-suffering pedestrians and cyclists are being discriminated against by drivers, who tend to be wealthier than their biking and walking neighbors.

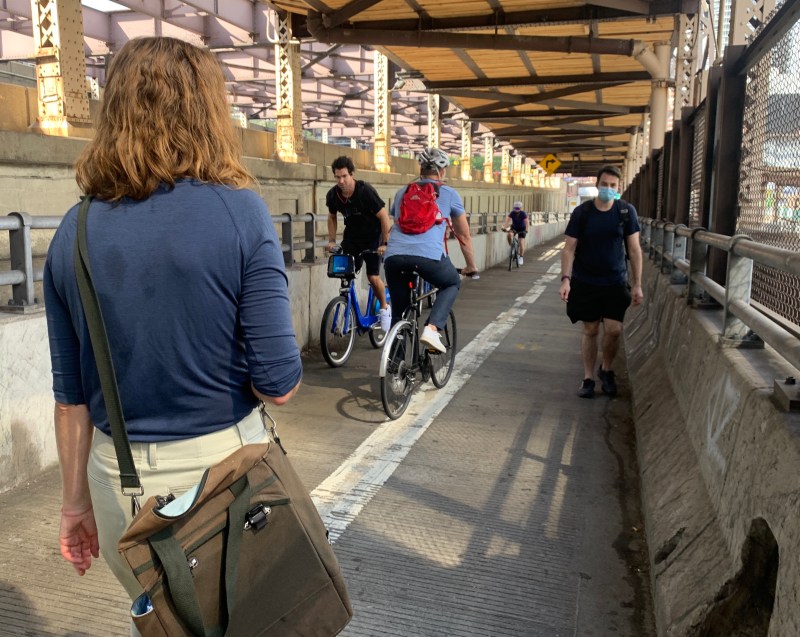
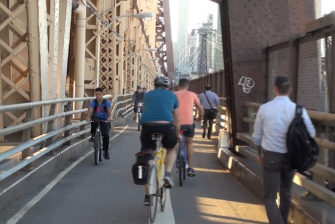
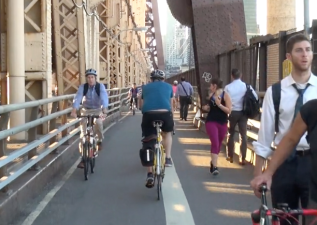
And on the face of it, the bridge’s allocation of space is unfair: Of the bridge’s 10 roadways, nine are reserved for drivers, one-half is reserved for walkers and one-half is reserved for cyclists, creating dangerous near-misses on the narrow bike/ped path.
But the human rights argument is backed by the latest numbers from the Department of Transportation:
In the three weeks before the state shutdown order, bike traffic on the Queensboro Bridge never exceeded 4,827 in a single day. In the 31 days of August, it exceeded that number 27 times, averaging 6,877 riders per weekday, up from the 3,652 weekday average in the first half of March.
That’s an 88-percent increase over March.
That trend continued into September. In the 27 days recorded so far this month, Queensboro Bridge traffic exceeded the pre-pandemic high water park 26 times, with an average weekday ridership of 7,302.
That’s a 100-percent increase over March — and another 6-percent increase from August.
During the same periods, other East River bridges for which DOT keeps counts experienced an uptick in bike traffic, but not nearly as impressive as the Queensboro:
- The Brooklyn Bridge’s weekday average was up 31 percent in August compared to the pre-pandemic March weeks. By September, it was up 52 percent compared to March.
- The Manhattan Bridge was up 38 percent through August and is up 58 percent so far this month compared to March.
- The Williamsburg Bridge was up 67 percent through August and is up 82 percent so far this month compared to March.
The four-bridge traffic bike traffic increase was 75 percent on August weekdays compared to March and 76 percent on September weekdays compared to March — most of that increase fueled by the explosion in weekday bike commuting over the Queensboro Bridge.
The weekend numbers tell the same story — New York City’s bridges don’t have enough space for pedestrians and cyclists, even during the hours when car travel declines:
- On the Queensboro Bridge, weekend average daily traffic in August was up 122 percent compared to the pre-pandemic weekend average in March. For the weekend days in September, the increase is 149 percent.
- The Brooklyn Bridge weekend daily average was up 197 percent in August compared to March, albeit with fewer total cyclists. In September, the increase rose to 240 percent.
- The Manhattan Bridge was up 119 percent on August weekends. By September, the comparison to pre-pandemic numbers was up 165 percent
- The Williamsburg Bridge was up 124 percent in August. It’s now averaging 145 percent more bike traffic than the pre-pandemic weekend average.
“Our streets and our bridges need the infrastructure that is necessary to keep us safe,” said State Senator Jessica Ramos, who started riding a bike in June and has expressed fears as a newbie cyclist.
Transportation Alternatives’ Executive Director Danny Harris said the fight for more space on the Queensboro Bridge was about “dignity and equity.”
Bike New York spokesman Jon Orcutt may not have had the numbers in his head at a “One More Lane” protest at the Queensboro Bridge on Sunday, but he put the bike boom into perspective, saying that years of city policies — mostly the construction of protected bike lanes that began in earnest under the Bloomberg Administration, in which Orcutt served — have created the bike boom that we’re now seeing. (Streetfilms was there; see video below.)
But during the pandemic — when bike riding is clearly surging — the de Blasio administration has not moved to radically redistribute roadway space. Yes, the administration has created roughly 20 miles of temporary protected bike lane space, but many of those lanes were already planned before the coronavirus crisis, and represent the city’s entire addition to bike infrastructure this year. Meanwhile, 17 cyclists have been killed so far this year — and five died in September alone.
Meanwhile, the mayor has been urged by activists, policy wonks and his own surface transportation panel to do more to reduce car use in the city, which is now exceeding pre-pandemic levels. Mayors around the world have used the pandemic to entirely reimagine their streetscapes, but the city has not, with predictable results:
On March 1, a Sunday, the city hosted 146,100,000 vehicle miles traveled. On Aug. 30, also a Sunday, that number had risen to 195,400,000, an entirely avoidable increase of 33 percent. Comparing the same figures for a pre-pandemic Friday vs. the last Friday in August revealed a 12-percent increase in car miles. (All car data provided by Streetlight.)
Orcutt added he wishes that hundreds of people didn’t have to protest for more space for pedestrians and cyclists, especially given the mayor’s stated Vision Zero goals.
“We still have to come out on the streets to get things done in the de Blasio administration,” Orcutt said. “On the one hand, it’s exhilarating that people turn out and we fight and we win. On the other hand, it’s depressing that we don’t have city leadership on this issue.”
For the record, the DOT sent over a statement on Sunday saying the agency will add more space for pedestrians and cyclists on the bridge, but it cannot happen before 2022, when a reconstruction project on the bridge’s upper levels will be completed.


