NUMBER-CRUNCH: Where the Drivers Speeding Like Mad (Lookout, Manhattan!)

They’re speeding everywhere — but mostly in the places with notorious local traffic. And the problem is getting way worse.
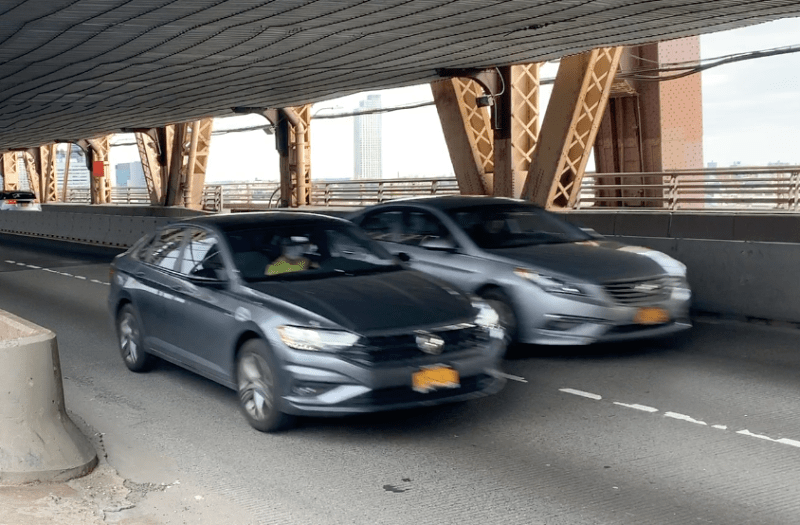
City stats show that drivers are motoring more recklessly now that fewer cars are on the road during the COVID-19 crisis, but Streetsblog’s latest number-crunching shows that the increase in speeding is the worst in Manhattan, Brooklyn and Queens.
Here’s the breakdown of camera-issued tickets by date (see chart below):

- Manhattan
- March 2: 860
- March 27: 2,085
- Increase: 58.75 percent
- Brooklyn
- March 2: 4,045
- March 27: 6,399
- Increase: 37 percent
- Queens
- March 2: 4,267
- March 27: 6,203
- Increase: 31 percent
- Bronx
- March 2: 2,001
- March 27: 2,644
- Increase: 24.3 percent
On Staten Island, camera-issued tickets are up roughly 3 percent, a function of that borough’s relatively free-flowing traffic on residential streets where the city places school-zone speed cameras.
The Manhattan numbers will surprise no one who has been outside since the coronavirus has cut the number of cars on the road. And tweets like this are a daily occurrence:
so @nycmayor appears to be letting new york turn into a large playground for two-ton vehicles. i walked past this crash on 11th ave a couple minutes after it happened; most of the hood was at 45th or so, the rest of it was at 44th. https://t.co/H2L6UTcsPQ @2AvSagas
— Calista McRae (@stuffedowl) April 7, 2020
Traffic engineer Sam Schwartz said it’s clear why drivers are speeding — because they can! After all, total vehicle miles traveled during the March 2 to March 27 period is down 72 percent, according to data provided by StreetLight and Cuebiq, which means there is plenty more space for drivers to go faster than the law allows.
“With less traffic, drivers are getting to their destinations faster than ever — so why speed?” Schwartz told Streetsblog. “I’m no psychologist, but maybe all the pent-up frustration, anger and anxiety is manifesting itself when people get behind the wheel.”
The borough-by-borough breakdown follows earlier coverage showing the dramatic increase in speeding in March, as fewer and fewer drivers were on the road. Last week, Streetsblog reported that city speed cameras had issued 12 percent more tickets in a 14-weekday period between March 5 and March 24 compared to a similar 14-weekday period in January.
That trend has, forgive the pun, accelerated since March 24. Three more days of Department of Finance statistics have just come online, revealing that from March 25-30, city speed cameras wrote 68,144 tickets, which is 36.3 percent more than the comparable period in January, when cameras issued 43,378 summonses (see chart).
No one seems to be doing anything about the problem. The NYPD has ignored repeated requests for comment on its strategy for halting the speeding crisis. And Gov. Cuomo, who has the power to lower speed limits or recalibrate the cameras so they can issue tickets before a driver is going 11 miles per hour or more above the speed limit, declined to comment on whether he would act.

